If you have trouble viewing this, try the pdf of this post. You can download the code used to produce the figures in this post.
Status of discussion of "Near optimal ..." paper
In this post I will summarize where I stand in the discussion of my paper, “Near optimal energy selective x-ray imaging system performance with simple detectors.” You will find it useful to download a free copy of the paper to follow along with this discussion.
The paper discusses whether and how much you can improve the signal to noise ratio (SNR) of an x-ray imaging system by measuring the energy spectrum of the radiation transmitted through the object instead of just measuring the total number of photons or their total energy as is now done with conventional systems. This question was addressed by a 1985 paper by Tapiovaara and Wagner[2]. They found that you can improve the SNR and gave a formula for the optimal SNR. That is, the best SNR that can be achieved by an x-ray system that measures the complete energy spectrum.
In their formulation, Tapiovaara and Wagner achieved the optimal SNR by multiplying the measured spectrum by an optimal weighting function and then integrating the product function over energy to give the quantity that is displayed in the image. They did not use the fact that the x-ray attenuation coefficient, which determines the information that you can get with an x-ray system, can be expressed as a linear combination of two functions of energy multiplied by constants as I have discussed many times in this blog. This is additional information that Tapiovaara and Wagner did not use so my question was whether using this information helps in making lower SNR images from energy spectrum measurements.
I found that using the decomposition helps in two ways. First, I showed that by using the information you can make images from low energy-resolution data with SNR near the optimum. This is different from Tapiovaara and Wagner who assumed that you measure the complete energy spectrum with infinitely high resolution. Also, with the decomposition you get additional information about the object that is not present in the single image that is produced by the Tapiovaara and Wagner approach.
The mathematical notation used in this post is explained in Table 1↓.
Use of SNR to characterize energy-selective imaging system performance
TW and my paper use SNR as a measure of system performance. Evaluating and comparing imaging system performance is a huge subject and many methods have been developed with opposing proponents. If this interests you, read the prologue section of Barrett and Myers book, Foundations of Image Science[1] to get a flavor of the complexity and the opposing schools of thought. As an aside, the book itself is well worth buying although I wish they would come out with an e-book version since the book’s size and weight makes it a pain to read.
I wanted to focus on the energy dependent information in my paper and most people would agree that SNR is a useful parameter to describe the quality of a medical imaging system so the discussion was based on it. If the noise is described by a multivariate normal distribution, this post shows that the error rate for hypothesis testing depends only on the SNR. The use of the multivariate normal to describe noise in an energy-selective system is justified here. This post describes its properties, the use of matrix calculus to manipulate it, and linear transformations to make the noise components uncorrelated and with equal variance, which are all used in the paper.
The optimal signal to noise ratio of an energy-selective x-ray system
TW derived their results by analyzing the system shown in Fig. 1↓. The imaging task decides from two measurements, one in a background region and the the other in a region that may contain an object of interest, whether the object is present. For example, the object might be a lung nodule in a chest x-ray image and the task is to decide from measurements of a region that may contain the nodule and a neighboring region known not to have a nodule whether the nodule is present.
I discussed the TW optimal SNR with complete energy spectrum information in this post. The optimal SNR for a low contrast feature, that is when μftf≪1 is
Writing this out as an integral,
In words, it is proportional to the number of photons, the thickness of the feature squared, and the effective value of the square of the difference of the attenuation coefficients of the feature and background.
In this post I used a Monte Carlo simulation to compare the TW optimal SNR with conventional energy integrating and photon counting detectors. The optimal SNR2 is approximately twice as large as the value with an energy integrating, which is used by almost all commercial medical x-ray imaging systems. Since the SNR2 is proportional to patient dose, this means that we could potentially reduce the noise by half or make comparable images with half the dose by using the energy information. Intuitively, the reason for this is that the object changes not only the total energy of the transmitted photons but also the shape of their energy spectrum. Conventional systems that only measure the total energy (or total number) of the photons are throwing information. By using this change in the spectrum, we can get more information about the object for the same dose.
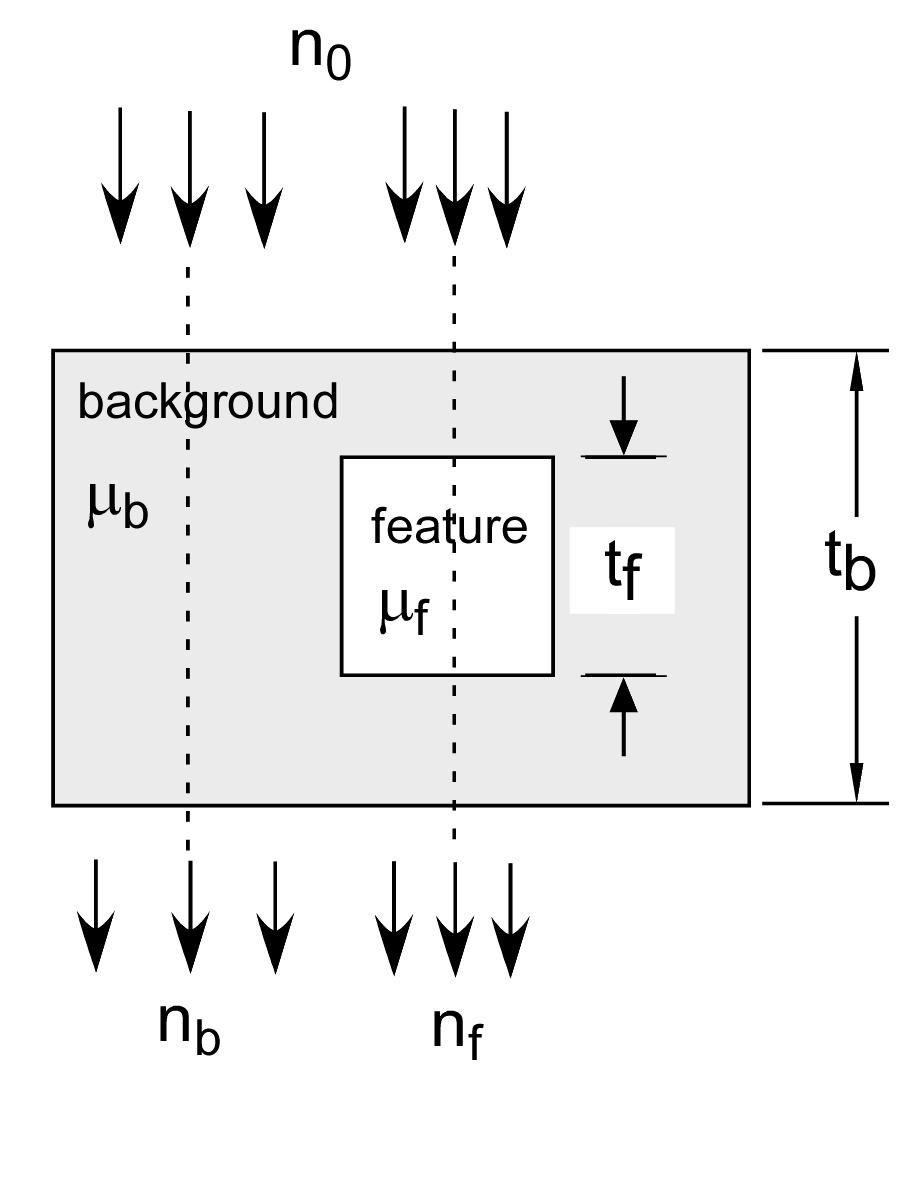
Table 1 Symbols
tb
thickness of feature
μb
feature att. coeff.
tf
thickness of background
μf
background att. coeff.
n(E)
photon number spectrum
λ
expected number of photons
E
photon energy
λ
⌠⌡n(E)dE
⟨⟩N
eff. value number spectrum
⟨E⟩k
eff. value of energy spectrum k
μ(E)
a1f1(E) + a2f2(E), linear decomposition
δμ
μf − μb
a1, a2
basis set coefficients
f1(E), f2(E)
basis functions
a
[
a1,
a2
]T
[]T
matrix transpose
A1, A2
basis set coefficient line integrals
A1
⌠⌡ Pa1( r)dr P line, r position
A
[
A1,
A2
]T
A
⌠⌡Pa(r)dr
SNR
signal to noise ratio
CA
covariance of A
I
measurement vector for spectra
L
− log(I⁄I0)
M
matrix of basis funcs. for mnt. spectra
M
(∂L)/(∂A)
The SNR with the two function decomposition
This post shows how to apply statistical estimation theory to analyze energy-selective systems that use the two function decomposition. This post shows how to use the two function linear decomposition to compute the SNR so the results can be directly compared with the TW optimal. I call this the A-space method. To use the decomposition, all we have to do is use the attenuation coefficients of the background and feature materials as the basis functions. That is
(3)
f1(E)
=
μb(E)
f2(E)
=
μf(E)
.
This is perfectly ’legal’ because in a two function linear space any two non-collinear functions, that is functions that are not multiples of each other, also span the space. The post shows that the approximation errors introduced by using even materials with similar composition are not substantially larger than those using an optimal set of basis functions derived from the singular value decomposition.
If we assume that the noise has a multivariate normal distribution (discussed here), the SNR2 for the TW imaging task with the A-space method is
(4) SNR2 = δATC − 1AδA
where δA = ⟨Afeature⟩ − ⟨Abackground⟩ is the difference between the A vectors in the background and feature region and CA is the covariance of the A vector measurements.
This post showed that the inverse of theA vector measurement covariance is related to the covariance of the detector data by C − 1A = (MTC − 1LM) so substituting in Eq. 4↑,
(5)
SNR2
=
δATC − 1AδA
=
δATMTC − 1LMδA
where M is the gradient of the log of the measurements
M = (∂L)/(∂A)
and L = − log(I ⁄ I0), I is the vector of the measurements and I0 is the measurement vector with no object in the beam. In this post, I show that M is also the effective attenuation coefficient matrix with the transmitted spectra. The columns of M are the average or effective attenuation coefficients of the each of the basis functions and the rows are the effective values for each of the measurement spectra.
From Eq. 5↑, in order to describe the SNR of a detector, we need formulas for the effective attenuation coefficient matrix M and the covariance of the log of the measurements CL. These were discussed in Section II.F of the paper.
Computation of M
We can understand the computation of M with a simple example: two-bin pulse height analysis (PHA). Suppose the spectrum is represented by a structure specdat with fields specnum, a one dimensional array specifying the number of photons, and egys, an array of the corresponding energies in keV. Also suppose the threshold index for the PHA is kthreshold so photons with energies less than egys(kthreshold) are counted in the first bin and those with larger energies are in the second bin. Also suppose the basis functions are in a two-column matrix fbasis with one row for each energy in specdat.egys. The code to compute the M matrix is shown in the following inset
%% compute M for two-bin PHA
[specdat.specnum,specdat.egys] = ...
XrayTubeSpectrumTasmip(120,’number_spectrum’,’clipzeros’);
% 120 kV, 1 keV step
negys = numel(specdat.egys); % number of energies in spectrum
kthreshold = round(negys/2); % threshold index for the two-bin PHA
% basis functions are the attenuation coefficients of water and aluminum
fbasis = zeros(negys,2);
fbasis(:,1) = xraymu(’H2O’,specdat.egys);
fbasis(:,2) = xraymu(’Al’,specdat.egys);
% compute M
M = zeros(2,2);
idxs2bins = {1:kthreshold,(kthreshold+1):negys}; % indexes to the PHA bins
for kbin = 1:2
idxs = idxs2bins{kbin};
for kbasis = 1:2
M(kbin,kbasis) = sum(specdat.specnum(idxs).*fbasis(idxs,kbasis))/ ...
sum(specdat.specnum(idxs));
end
end
%% display result
disp(’M’)
disp(M)
M
0.3143 0.8227
0.1844 0.2067
The first row of M is the effective attenuation coefficients of water and aluminum for the spectrum below the threshold energy. Notice that the attenuation coefficient of water in the first column is smaller than the attenuation coefficient of aluminum in the second column. The second row is the values for the spectrum above the threshold. These correspond to a larger energy so they are smaller than the corresponding values in the first row.
Covariance for photon counting detector with pulse height analysis
The next series of posts described how to compute the covariance of the measurements CL for common detector types.
This post discusses the photon counting detector with pulse height analysis (PHA). The post shows that the SNR with K bins is
where tf is the thickness of the feature object in Fig. 1↑, ⟨n⟩k is the expected number of counts and ⟨μ2 − μ1⟩k is the effective value of μ2(E) − μ1(E) in the spectrum of bin k. Letting the number of bins go to infinity, we can use Eq. 6↑ to derive the SNR with complete energy information
SNR2ideal = (λt2f)/(2)[⌠⌡n̂(E)δμ(E)dE]2 = λt2f⟨δμ⟩2N ⁄ 2
where n̂(E) is the spectrum normalized by dividing by its integral
n̂(E) = (n(E))/(⌠⌡n(E)dE)
and δμ(E) = μ1(E) − μ2(E) is the difference of the two basis functions. As expected, this is the same as the TW optimal SNR in Eq. 1↑ except for the factor of 1⁄2 that is due to using two measurements (in the background and feature region) instead of one as is assumed in Eq. 5↑.
NQ detector
In this post and this post I discuss the NQ detector that simultaneously measures the number of counts and the integrated energy. The derivation also gives the SNR with photon counting and energy integrating detectors individually. These are
SNR2N = (λt2f)/(2)⟨δμ⟩2N
and
SNR2Q = (λt2f)/(2F)⟨δμ⟩2Q
The SNR with using both signals from the NQ detector at the same time
SNR2NQ = (λt2f)/(2)⎡⎣⟨δμ⟩2N + ((⟨δμ⟩N − ⟨δμ⟩Q)2)/(F − 1)⎤⎦
where F = ⟨E2⟩⁄⟨E⟩2 is the excess variance of the spectrum. In the posts on this detector, I show that
SNR2ideal ≥ SNR2NQ ≥ SNR2N ≥ SNR2Q.
That is, the NQ detector is better than either detectors that only count photons or measure integrated energy individually.
The NKQ detector
My last post discussed the NKQ detector, which is a generalization of the NQ detector. Schematic diagrams of the two detectors are shown in Fig. 2↓
(a) 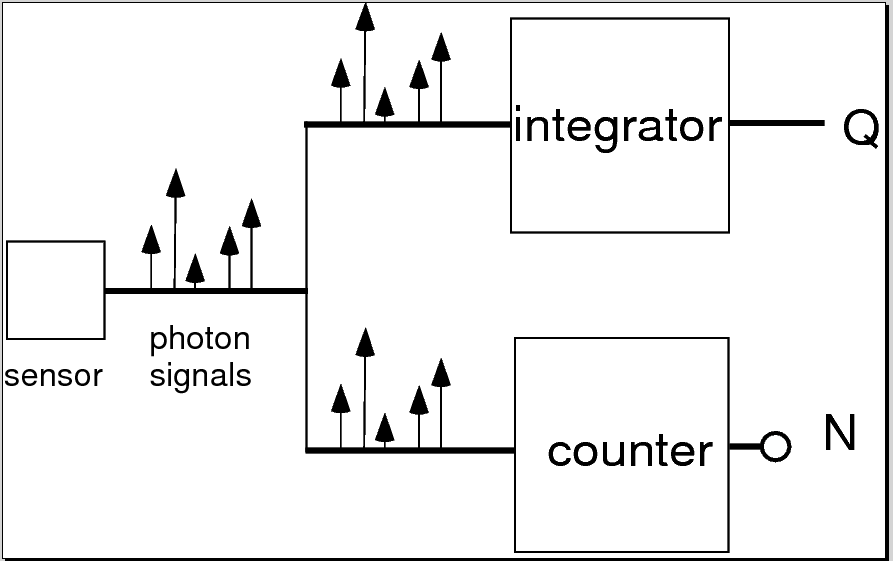
(b)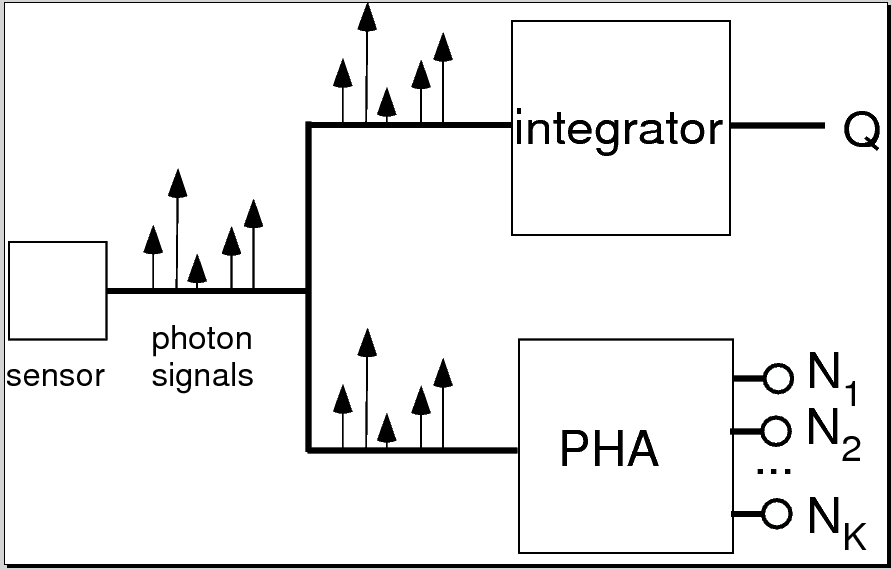
(b)
Figure 2 Comparison of NQ and NKQ detector. The NQ detector shown in panel (a) (top) splits the signal from the sensor and simultaneously measures the total energy (Q) and counts the number of photons (N). The NKQ in panel (b) (bottom) also splits the signal and measures the total energy but does K bin pulse height analysis on the other signal.
I showed that the covariance of the log of the NKQ signals is
Cov({log(Nk), k = 1…K}, log(Q)) = (1)/(λ)⎡⎢⎢⎢⎢⎢⎢⎢⎣
λ ⁄ λ1
0
⋯
0
(⟨E⟩1)/(⟨E⟩)
0
λ ⁄ λ2
0
0
(⟨E⟩2)/(⟨E⟩)
0
0
⋯
0
⋮
0
0
0
λ ⁄ λK
(⟨E⟩K)/(⟨E⟩)
(⟨E⟩1)/(⟨E⟩)
(⟨E⟩2)/(⟨E⟩)
⋯
(⟨E⟩K)/(⟨E⟩)
F
⎤⎥⎥⎥⎥⎥⎥⎥⎦
where λk is the expected value of the total number of photons and ⟨E⟩k is the effective energy for the photons in bin k. F is the excess variance
F = (⟨E2⟩)/(⟨E⟩2).
Conclusion
That brings us up to date. In the next posts, I will compute numerical values for the SNR with each of the detectors using the A-space method and compare them to the TW theoretical optimum.
Last editedFeb 06, 2013
© 2013 by Aprend Technology and Robert E. Alvarez
Linking is allowed but reposting or mirroring is expressly forbidden.
References
[1] : Foundations of Image Science. Wiley-Interscience, 2003.
[2] : “SNR and DQE analysis of broad spectrum X-ray imaging”, Phys. Med. Biol., pp. 519—529, 1985.