If you have trouble viewing this, try the pdf of this post. You can download the code used to produce the figures in this post.
The NKQ detector
The NKQ detector introduced in my paper[1] is a generalization of the NQ where instead of just counting the photons we use pulse height analysis (PHA) to separate the photons into K bins depending on their energies and simultaneously measure their total energy. This gives performance similar to PHA with the number of bins plus one so it may be easier to implement. As with the NQ detector, the integrated energy Q can be used in regions where high count rate leads to excessive pulse pileup.
Covariance of NKQ Detector Measurements
With no pulse pileup, the numbers of photons in the individual PHA bins, {N1, N2, …NK}, are independent Poisson random variables with parameters λk, k = 1…K. The total number of photons, N, is the sum
N = K⎲⎳k = 1Nk.
Since the sum of independent Poisson random variables is also a Poisson random variable with parameter equal to the sum of the parameters of the terms, N is Poisson with parameter
λ = K⎲⎳k = 1λk.
The NKQ detector also measures the total energy Q of all the photons.
The mean value vector of the measurements is
⟨⎡⎢⎢⎢⎢⎢⎢⎢⎣
N1
N2
⋯
NK
Q
⎤⎥⎥⎥⎥⎥⎥⎥⎦⟩ = ⎡⎢⎢⎢⎢⎢⎢⎢⎣
λ1
λ2
⋯
λK
λ⟨E⟩
⎤⎥⎥⎥⎥⎥⎥⎥⎦.
To derive the joint statistics, we only need to consider the two bin case and derive the results for cov(N1, Q). These results can be immediately generalized to the K bin case because, from the point of view of the analysis, all the other measurements can be summed to a single Poisson random variable that is independent of N1,so is equivalent to the two bin case. Also, without loss of generality, the results for N1 are applicable to any of the other individual measurements. The covariance of N1 and Q is defined as
Expanding the product
Expanding the first term
(3) ⟨N1Q⟩ = ⟨⟨N1Q⟩|N1 = n⟩ = ∞⎲⎳n2 = 0∞⎲⎳n1 = 0n1⟨n1⎲⎳i = 1Ei + n2⎲⎳i = 1Ei⟩Prob{N1 = n1}Prob{N2 = n2}.
The E random variables have same probability distribution so
⟨n1⎲⎳i = 1Ei⟩ = n1⟨E⟩1
where ⟨E⟩1 denotes the mean value of the instances of E in the first bin. Similarly
⟨n2⎲⎳i = 1Ei⟩ = n2⟨E⟩2.
Substituting in (3↑)
⟨N1Q⟩ = ∞⎲⎳n2 = 0∞⎲⎳n1 = 0 [n21⟨E⟩1 + n1n2⟨E⟩2]Prob{N1 = n1}Prob{N2 = n2}
⟨N1Q⟩ = ⟨N21⟩⟨E⟩1 + λ1λ2⟨E⟩2
where the last step uses the fact that N1 and N2 are independent. The second moment of a Poisson random variable is
⟨N21⟩ = λ21 + λ1.
The final result for the first term in (2↑) is
⟨N1Q⟩ = (λ21 + λ1)⟨E⟩1 + λ1λ2⟨E⟩2
In the second term in (2↑), < N1 > = λ1 and < Q > = (λ1 + λ2)⟨E⟩. The overall mean value ⟨E⟩ can be expressed in terms of the bin mean values as
⟨E⟩ = (λ1⟨E⟩1 + λ2⟨E⟩2)/(λ1 + λ2)
so the second term is
< N1 > < Q > = λ21⟨E⟩1 + λ1λ2⟨E⟩2.
Combining the first and second terms gives the final result
cov(N1, Q) = λ1⟨E⟩1.
By the argument stated above, this can be generalized to
cov(Nk, Q) = λk⟨E⟩k.
As previously derived the variance of Q is σ2Q = λ⟨E2⟩, so the covariance matrix is
(4) Cov({Nk, k = 1…K}, Q) = ⎡⎢⎢⎢⎢⎢⎢⎢⎣
λ1
0
0
0
λ1⟨E⟩1
0
λ2
0
0
λ2⟨E⟩2
0
0
⋯
⋯
⋯
0
0
⋯
λK
λK⟨E⟩K
λ1⟨E⟩1
λ2⟨E⟩2
⋯
λK⟨E⟩K
λ⟨E2⟩
⎤⎥⎥⎥⎥⎥⎥⎥⎦.
Covariance of logarithm of NKQ measurements
The same arguments used in the previous section are also applicable to the logarithms of the measurements, so I will derive the covariance of log(N1) and log(Q) for the two group case. Using the general result
cov[log(N1), log(Q)] = ⟨log(N1)log(Q)⟩ − ⟨log(N1)⟩⟨log(Q)⟩.
As with the derivation for the NQ detector, the first term is
⟨log(N1)log(Q)⟩ ≈ log[⟨N⟩]log[⟨Q⟩] + (cov(N1, Q))/(⟨N1⟩⟨Q⟩).
Inserting the results from the previous section
(cov(N1, Q))/(⟨N1⟩⟨Q⟩) = (⟨E⟩1)/(⟨Q⟩).
Combining these
cov[log(N1), log(Q)] = (⟨E⟩1)/(⟨Q⟩)
Using the result from the NQ detector for the variance of log(Q) and recalling that F = (⟨E2⟩)/(⟨E⟩2) and ⟨Q⟩ = λ⟨E⟩, the covariance matrix is
Cov({log(Nk), k = 1…K}, log(Q)) = (1)/(λ)⎡⎢⎢⎢⎢⎢⎢⎢⎣
λ ⁄ λ1
0
⋯
0
(⟨E⟩1)/(⟨E⟩)
0
λ ⁄ λ2
0
0
(⟨E⟩2)/(⟨E⟩)
0
0
⋯
0
⋮
0
0
0
λ ⁄ λK
(⟨E⟩K)/(⟨E⟩)
(⟨E⟩1)/(⟨E⟩)
(⟨E⟩2)/(⟨E⟩)
⋯
(⟨E⟩K)/(⟨E⟩)
F
⎤⎥⎥⎥⎥⎥⎥⎥⎦.
Monte Carlo simulation of N2Q statistics
The code for this post shows how to generate Fig. 1↓, which compares the N2Q covariance and correlation with the theoretical results in Eq. 1↓. These quantities are plotted versus the inter-bin separation energy of the two bin PHA. Note that the correlation (and covariance) of the counts with Q increases for N1 but decreases for N2 as the threshold energy increases.
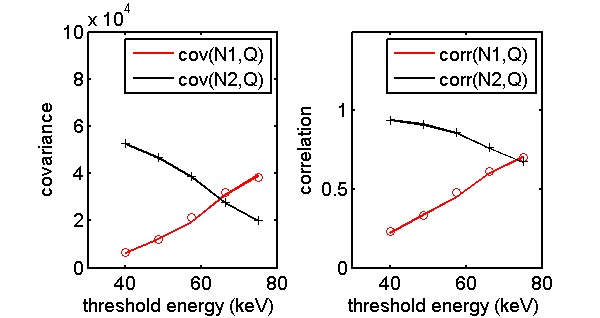
Figure 1 N2Q statistics. Shown are both the covariance and the correlation of the two photons counts and the total energy. The solid lines are the theoretical values from Eq. 4↑ while the symbols show the Monte Carlo values.
Conclusion
The theoretical formulas derived in this post fit the Monte Carlo simulation results. I was not able to derive simple analytical formulas for the NKQ SNR so future posts will compute it numerically and compare it to the optimal SNR with complete information and also to other types of detectors.
Last editedDec 06, 2012
© 2012 by Aprend Technology and Robert E. Alvarez
Linking is allowed but reposting or mirroring is expressly forbidden.
References
[1] : “Near optimal energy selective x-ray imaging system performance with simple detectors”, Med. Phys., pp. 822—841, 2010.