If you have trouble viewing this, try the pdf of this post. You can download the code used to produce the figures in this post.
The uses of complex variables in Matlab
One of my Matlab programming styles, some would say quirks, is wide use of complex variables. I not only use them in the standard mathematical places but I use them to represent two dimensional spatial vectors and to represent two dimensional quantities in general.
Using complex numbers to represent two dimensional vectors is straightforward, a complex number is x + iy. OK, so why do it? First, Matlab handles complex numbers seamlessly. So, adding two complex numbers is a vector addition. All the standard data structures such as vectors, matrices, and multi-dimensional arrays can use complex numbers. Many functions such as linspace and plot handle complex numbers. You do need to be aware of some quirks. The transpose operator ’ also does a complex conjugate. If this is not what you want, use .’.
What about the standard vector products? For these you have to remember some formulas
% dot product with complex numbers: real(z1* conj(z2) ) real( z1s .* conj(z2s)) %arrays % cross product imag(conj(z1)*z2) imag(conj(z1).*z2) % arrays
To help me to use complex numbers I wrote the zcomp function. This is a two way function to convert from real to complex and vice-versa. This avoids having to use complex() and [real() imag()]. Some examples:
% real to complex zrnd = zcomp(rand(100,2)); % reals must be 2 column matrix % znrd is a one-dimensional vector % complex to real rnd = zcomp(zrnd); % returns a 2 column matrix
My PolarTransform.m function is an example of the use of complex numbers as coordinates of an image. The function extracts a pie-shaped sector from an image. Fig. 1↓ shows how it is used. The left panel shows the original image, the center shows a subset of the sample points, and the left panel shows the sector image. It is flipped so the sector center is below the bottom.
%% PolarTransform example
img = imread(’moon.tif’); % included with Matlab image processing toolbox
zcenter = zcomp([237 281]);
[pim,zoff] = PolarTransform(img,zcenter,linspace(5,250), ...
linspace(110,290)*pi/180);
%% display images
fh = figure;
subplot(131)
imshow(img,[]);
subplot(132)
imshow(img,[]);
hold on,plot(zoff(1:10:end),’.y’),hold off
subplot(133)
imshow(flipud(pim));
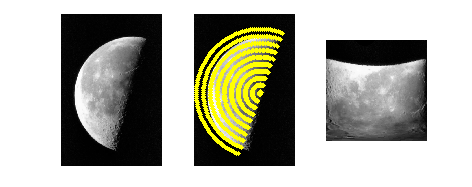
Figure 1 PolarTransform.m example
The code for the function is below. It shows how complex numbers as vectors allow compact and readable code.
[pim,zoff] = PolarTransform(img,zcenter,rs,thetas) % function [pim,zoff] = PolarTransform(img,zcenter,rs,thetas) % extract the polar transform of a pie-shaped section of img % inputs: % img: the image % zcenter: (x+iy), the center of the region % rs: (pixels) the radii. If scalar then the radii are 1:r % thetas: (radian) the angles. If scalar, assumes this is increment in angles from 0 to 2*pi % outputs: % pim: the polar transformed image % zoff: the coordinates of the sample points in the original image (x+iy) % REA 4/15-8/8/11 if isscalar(rs) rs = 1:round(rs); end if isscalar(thetas) thetas = linspace(0, 2*pi , round(2*pi/thetas) ); thetas = thetas(1: (end-1) ); end [thetas_img,rs_img] = meshgrid(thetas,rs); % offset the x,y coords to the appropriate location zoff = rs_img.*exp(1i*thetas_img) + zcenter; % and extract the image data pim = interp2(img,real(zoff),imag(zoff),’nearest’);
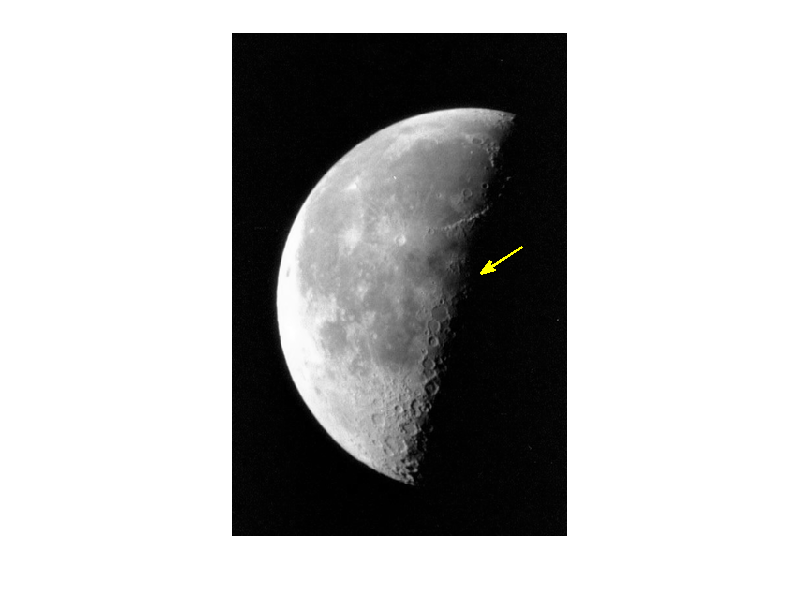
Another useful utility function is zarrow. This draws an arrow on an image from start and end points in image coordinates. It uses the Matlab annotation function, which is a misbegotten creation that specifies the arrow endpoints in normalized figure units with the x’s and y’s specified separately! zarrow uses complex vectors to specify the arrow more naturally in image coordinates. Fig 2↓ shows how to draw an arrow to the center of the pie-shaped sector in the previous example.
A final example exploits Matlab’s mysterious ability to handle integers and floating point numbers with the same variable. In some of my work I have to deal with patient IDs. These are anonymized to protect confidentiality and consist of a Series ID, which is a letter, and a patient number. Dealing with these is a pain since it is easy to interchange them so I represent the complete ID as a complex number zpatid, where the real part is the ASCII code of the Series ID and the imaginary part is the patient number. Even though complex numbers are double’s Matlab has no problem testing two zpatid’s for equality.
We also need better ways to sort complex numbers. The Matlab sort function results in a weird ordering by the magnitude of the complex numbers. I wrote the zsort function that gives more options for sorting. The default is a lexical sort that sorts first by the real part then by the imaginary.
You can download the code for all the functions mentioned here.
I will have more to say later on using complex variables including functions to implement a statistical shape model for Active Shape Model image segmenting[1].
Last edited Aug. 9, 2011
© 2011 by Aprend Technology and Robert E. Alvarez
Linking is allowed but reposting or mirroring is expressly forbidden.
References
[1] : “Active shape models - their training and application”, Computer Vision and Image Understanding, pp. 38—59, 1995.