If you have trouble viewing this, try the pdf of this post. You can download the code used to produce the figures in this post.
SNR with pileup-3: PHA detector statistics with pileup
This post continues the discussion of my paper “Signal to noise ratio of energy selective x-ray photon counting systems with pileup”[1], which is available for free download here. Following the road map described in my last post, I am deriving and validating formulas for the statistics of photon counting detectors with pileup. In this post, I describe formulas for the expected value and covariance of pulse height analysis data with pileup and present software to verify the formulas with Monte Carlo simulations.
I have derived the formulas for PHA statistics with pileup in several previous posts. The best way to read them is in my ebook, which you can get by emailing me. The derivation is split into several posts, which are in Part IV of the ebook but also accessible online.
- The theory for recorded counts with dead time is derived in this post.
- The formulas for the recorded energy spectrum are derived here.
- The theory for the expected values and covariance of PHA data is derived in this post.
- A Monte Carlo validation is described here.
In this post, I summarize the formulas for PHA with pileup and validate them with a Monte Carlo simulation. I will repeat the previous validation using random data generated with the PileupPulses function from the first post in the series on the SNR paper. I think this is easier to understand than the version used previously.
PHA formulas
The formulas for PHA with pileup are summarized in the following tables repeated here from this post. They were derived in the posts listed in the previous section.
The expected value, variance and covariance of the recorded counts for bin k, Mk, are
| expected value | ⟨Mk⟩ = ⟨M⟩pk |
| variance | var(Mk) = ⟨M⟩pk + (var(M) − ⟨M⟩)p2k |
| covariance | cov(Mj, Mk) = pjpk(var(M) − ⟨M⟩) |
The variables in these formulas are defined in this table:
| dead time | τ |
| mean incident count rate | λ |
| integration time | T |
| mean incident counts | N0 = ∫S(E)dE = λT |
| expected total recorded counts | ⟨M⟩ = (λT)/(1 + λτ) |
| variance of recorded counts | var(M) = (λT)/((1 + λτ)3) |
| normalized incident spectrum | s(E) = (S(E))/(N0) |
| bin fraction | pk = (∫EkEk − 1Sdeadtime(E)dE)/(∫Sdeadtime(E)dE) |
| spectrum with pulse pileup | Sdeadtime(E) = N0∑∞k = 0((λτ)k)/(k!)e − λτ(s(k)*s) |
Validate PHA formulas with Monte Carlo simulation
These formulas were validated with a Monte Carlo simulation in this post.
The random data were generated with the same code used for the NQ simulation in my last post. This code uses the PileupPulses function introduced in the first post of this series. The bin counts were generated from the recorded energies data in the egys_rec variable with the Matlab histogram bin counts function histc as shown in the code snippet below:
1[npulses_record, egys_rec] = PileupPulses(dt_pulse,deadtime, ...
2            t_integrate,’specinv’,spinv);
3            % PHA data
4counts = histc(egys_rec,egy_bin_edges);
5phacnts(kdead, ktrial, :) = counts(1:(end-1));
Two bin PHA was used with an interbin energy specified by specdat.Ethreshold. This required the following bin edges values as input for histc:
1egy_bin_edges = [0 specdat.Ethreshold inf];
A length three array is required because of a peculiarity in the design of histc. The last value in the counts array is the number of input values that are equal to the last value in the egy_bin_edges array. By setting the end value equal to infinity, we guarantee that all recorded events with energy greater than the threshold are in the second bin and all energies less than the threshold are in the first bin.
Comparison of Monte Carlo statistics with theoretical formulas
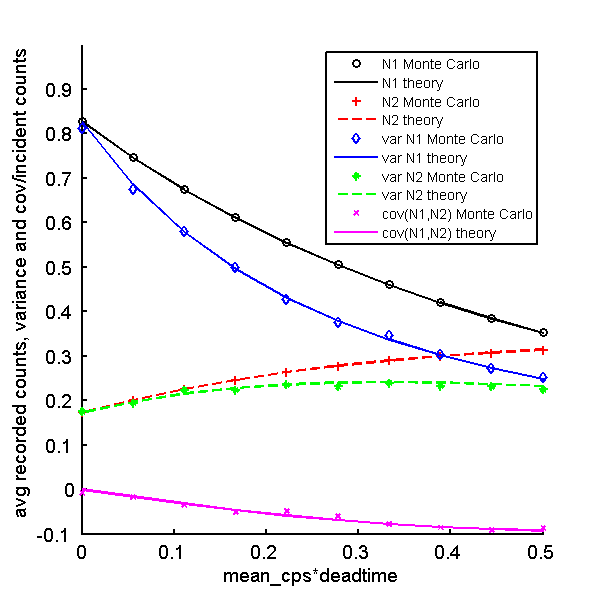
The next code block implements the theoretical formulas in the tables with the parameters used to generate the random data. These theoretical results are plotted along with the Monte Carlo results in the remaining part of the code block. The plots are shown below:

Figure 1 Comparison of Monte Carlo statistics with theoretical formulas. Shown are the mean values, variances and covariance of the recorded counts of the two PHA bins. The Monte Carlo data are the discrete symbols while the theoretical results are plotted as lines. Notice that the covariance is negative.
Conclusion
The formulas are validated by the Monte Carlo simulation for the values tested.
--Bob Alvarez
Last edited Jan 05, 2015
Copyright © 2014 by Robert E. Alvarez
Linking is allowed but reposting or mirroring is expressly forbidden.
References
[1] : “Signal to noise ratio of energy selective x-ray photon counting systems with pileup”, Med. Phys., pp. -, 2014.