If you have trouble viewing this, try the pdf of this post. You can download the code used to produce the figures in this post.
Dimensionality and noise in energy selective x-ray imaging-Part 2
The previous post in this series discussed the mathematics behind the increase in noise with the dimensionality, the number of basis functions used to approximate the attenuation coefficient. The series of posts is based on my recently published paper, Dimensionality and noise in energy selective x-ray imaging, available for free download here. This post describes simulations of the increase in noise with an object composed of body materials and an x-ray tube spectrum. The next post will show how to make low-noise images with the same properties as conventional x-ray images from the energy spectrum data. The main purpose of these last two posts is providing and explaining the code to reproduce the images in the paper.
The simulations
The simulations show images of an object made with an x-ray system. An x-ray tube generates a broad spectrum, which is incident on the object shown in Fig. 1↓. An energy-selective imaging detector is placed on the side of the object opposite the detector. The detector has nx by ny pixels and each is assumed to measure the spectrum incident on it with 1 keV resolution. The usual assumptions about quantum noise limited detectors with no pileup, no scatter, etc. are made and the noisy data are computed for several total photons per pixel cases. The simulation code is similar to that used in a previous post.
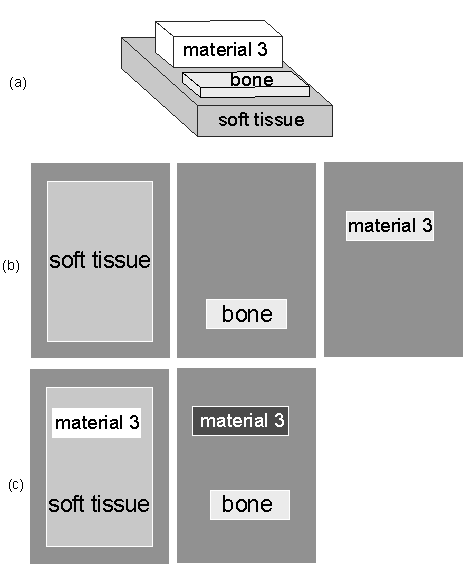
The same data can be processed assuming either a two or three function basis set so we can see the effect of adding an additional basis function. Since the raw data with noise are the same, the only difference for each case is the dimensionality. In the simulation, the basis functions are the attenuation coefficients of the object materials. The object always has soft tissue and bone but the third material changes. In one case it is adipose tissue and in the other it is an externally administered iodine contrast agent.
The code
The code is in two files. The main one P44mudim2.m prepares the attenuation coefficient, spectrum, and object geometry parameters. It then runs MakeMudimImages.m to make the noisy image data. The spectrum and attenuation coefficient data are generated using functions that I used previously. The attenuation coefficients of body tissues were generated using atomic compositions from the ICRU database[1]. The object is generated using my Sim2D.m function. This computes images of the thicknesses of objects in standard shapes like rectangular parallelepiped blocks. The object is built up from three boxes, which are composed of the three materials. This allows us to compute the transmission as a function of energy in each pixel by multiplying each box thickness by its attenuation coefficient as a function of energy.
The MakeMudimImages.m function is straightforward. Once the transmission as a function of energy for each pixel is known, the transmitted spectrum is computed by multiplying the incident normalized spectrum by the transmission. This results in an (nx*ny, number_energies) matrix of the expected number of photons for each pixel and each photon energy. These are multiplied by the total number of photons in the spectra for each case giving the expected values. The expected values are used to generate random photon counts data using a Poisson distribution. If the minimum value for any pixel is greater than 100 then the normal approximation to the Poisson is used since it is much faster to compute.
The random counts data are then used to compute the random A-vector values for each pixel using a linearized maximum likelihood estimator. The estimator is discussed in the paper and also in this post and others. The object was made thin so the linearizing assumption was reasonable. It is very fast because it can be implemented as matrix multiplication.
The images
The images are the same as those in the paper to within random fluctuations. I will not reproduce them here but I refer you to the paper that can be downloaded here.
Comments
Due to spam, I have turned off comments. If you want to comment send me an email at the address shown here.
--Bob Alvarez
Last edited Aug 22, 2014
Copyright © 2014 by Robert E. Alvarez
Linking is allowed but reposting or mirroring is expressly forbidden.
References
[1] : Report 44: Tissue Substitutes in Radiation Dosimetry and Measurement. URL http://www.icru.org.